Note: I want to thank Algoseek for providing historical SPY option-chain data at a very reasonable price. Algoseek provides all the market data you could possibly need, including equity, future, option, forex, crypto data, and more! If you're interested in high quality market data at low quality prices, check them out here!
Before the Black Monday market crash of 1987, options of different strike prices for the same expiration had roughly the same implied volatility (IV), inline with the popular Black-Scholes model. After the crash however, sellers of options realized that perhaps they were taking on too much long-tail risk since the underlying equities exhibit excess kurtosis compared to a normal distribution – one of the assumptions of Black-Scholes. Sellers proceeded to start charging a premium for options that were either far in-the-money (ITM) or out-of-the-money (OTM). Let's look at different SPY calls on 2020-05-01 all expiring on 2020-06-01:

While Black-Scholes would suggest a uniform distribution (each option would have the same IV), it's clear from the graph that the far ITM and OTM options are overpriced with respect to Black-Scholes: this phenomenon is dubbed the "volatility smile." But if the volatility smile is due to excess kurtosis of the underlying, can we forecast future market kurtosis using the dispersion of option IVs? In this short post we'll look at SPY call options between 2012-01-03 and 2020-07-16 in order to see if a higher standard deviation of option IVs is a predictor of SPY excess kurtosis.
Methodology
The methodology is simple, we will look at a simple linear regression between the standard deviation of calls with the same maturity date and the excess kurtosis of SPY between the current date and the maturity date:
\[\text{Kurt}[r_{SPY}] \sim \sigma_{IV}\]We will restrict the data set to only calls that expire before today's date so that the kurtosis of the market between the date of the option and maturity can be fully quantified. If the IVs of each option at each strike is the same in accordance to Black-Scholes, the standard deviation will be zero; if the market returns fit a log-normal distribution, the excess kurtosis will be zero as well. Let's look at the output of the linear regression:
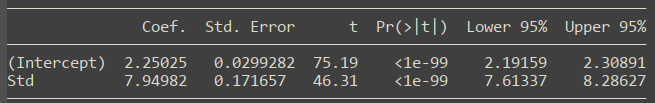
Not a particularly great fit, but it does seem like there's a positive correlation between the standard deviation of IVs and the future market kurtosis. In addition, the R-squared is 4.12%, which means that the linear model predicts only 4.12% of the future kurtosis of the market. Even so, the model does explain some of the future kurtosis of the market and the coefficient is positive, meaning that indeed a greater dispersion of option IVs is positively correlated with future excess kurtosis.
Conclusion
While not a particularly powerful nor predictive model on its own, this result does lend some credence to the origin of and reason for the volatility smile of IVs.
Thanks for reading, hope you liked this short post! Like last time, I won't be sharing the code for this one as the option data isn't publicly available and without the data, the code doesn't have much value. If, however, you are interested in accessing the data, check out Algoseek for all of your option data needs (and more!).