Did you know there's one weird trick that Wall Street doesn't want you to know? For only one payment of $39.99, you can get access to this limited time only exclusive video that will show you how to fight that bear market! Click here before Wall Street makes it illegal… Or you could just read this post, I guess.
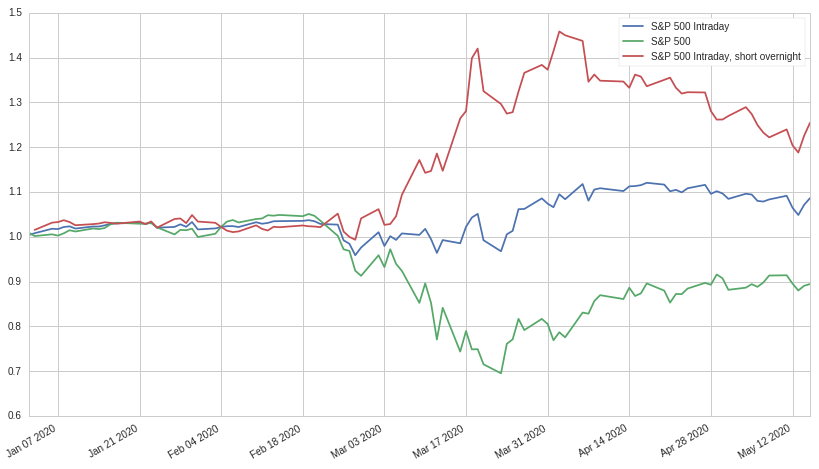
Anyways, when backtesting data I came across an interesting and surprisingly simple strategy that has performed very well during the coronavirus period. Simply put, most of the volatility during this period has occured overnight, that is, between market close and the opening auction the next day. This volatility has primarily been negative, with large downward price differences between the closing price and the opening price the next day. The intraday market on the otherhand has mostly stayed flat or gone up modestly. Let's take a look at three different portfolios: one where we just hold the S&P 500, the other where we buy the S&P 500 at market open and sell at market close, and a third where we do the same but also short the S&P 500 between the close and market open:

We see that before coronavirus significantly impacts the market, the returns of all three strategies are relatively similar: little dispersion is observed in the overnight market and large moves are primarily contained to the regular intraday session. Around the end of February, things begin to change: global coronavirus news begins to dramatically increase the difference between the closing and opening prices. By executing a strategy as simple as only holding the index intraday, we convert a 10% loss into a 10% profit, a pretty incredible difference. Taken one step further, we can even short the overnight market and net an eye-popping 25% gain over this five and a half month period!
While the mechanisms for this trend aren't entirely clear, I suspect this pattern occurs when global markets start to exhibit a very high correlation to each other. Since coronavirus is a global problem, most markets across the world are being affected by the same fundamental factors. Because of this, the price difference between the close and open in the US has been a reflection of moves in the European and Asian markets: when the foreign markets crash, it's highly likely that the American market will open down in the morning. If, on the otherhand, coronavirus caused a local recession (imagine if coronavirus was only a US phenomenon), I suspect that we wouldn't see the same overnight high-volatility trend.
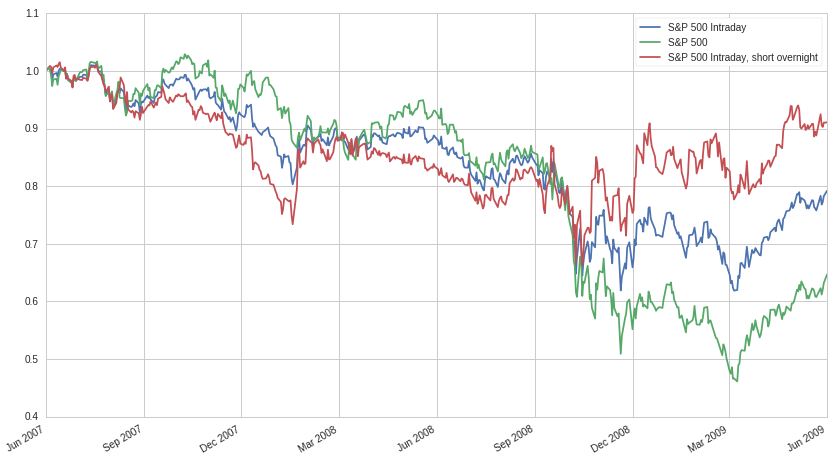
Now, let's look at the previous global recession, here's the same graph as before but between 2007-06-01 and 2009-06-01:

We observe the exact same phenomenon, with large moves in the overnight markets. Even so, much more volatilty was present in the intraday markets than now: even when using the long intraday, short overnight strategy we would have still ended up down about 10% over the two year period. Using our aforementioned hypothesis, this makes sense at the overnight difference isn't as pronounced: the US was the epicenter of the Great Recession, so the overnight markets are affected comparatively less than during the current period.
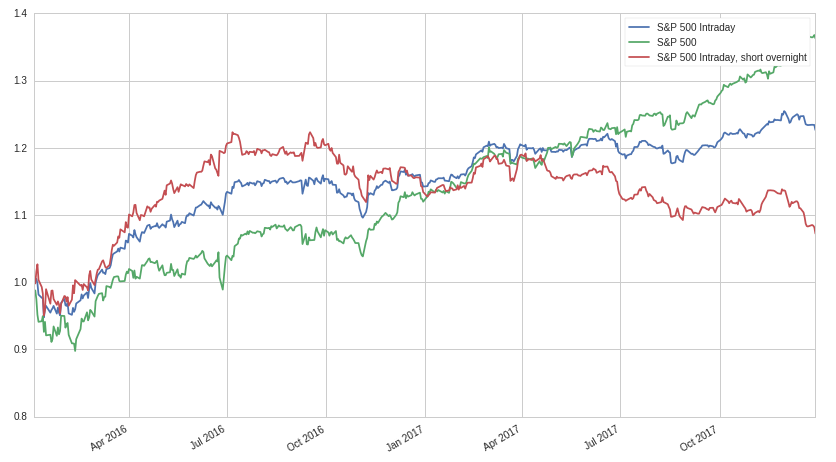
Finally, for contrast, the same strategies during the raging bull market between 2016-01-01 and 2018-01-01:

Unsurprisingly, both the long intraday and long intraday, short overnight strategies leave money on the table compared to the vanilla portfolio. Even so, both net a not so unsubstantial return during this two year period: the long intraday of around 23% and the long intraday, short overnight of around 8%.
Conclusion
One last thing to keep in mind is that even with zero comissions, the act of buying after the open and selling before the close incurs large trading costs: even assuming you're buying large cap stocks with low spreads (let's assume around 4 bips or 0.04%), the annualized cost comes to around 10% alone!
Even so, shorting or zeroing out overnight exposure can be a powerful tactic during tumulteous markets: especially if markets around the world are moving in lockstep. In addition, a small return can be made on top from the lending of overnight money (though it doesn't help that interest rates are often lowered close to zero during these periods).
I hope you enjoyed this post! If you want to check out the Quantopian notebook used to generate the above graphs, click here. Feel free to play around with the dates, though unfortunately, data isn't available before 2002.