In today's post, we will dig into the nature and value of analyst recommendations in order to try to answer an old but controversial question: do sell-side analyst recommendations hold any predictive power; and if so, when and why? The data we will use for this analysis is the FactSet Estimates - Broker Recommendations dataset, available free of charge on Quantopian.
Background
Analyst recommendations and letters are as old as Wall Street itself: traditionally provided as free reports for a broker or investment bank's buy-side institutional clients. A bank might employ many different equity analysts, each focusing and covering a basket of stocks, usually all in the same sector. In addition to publishing qualitative reports, a quantitative numerical score is also provided. While different firms have adopted different rating systems, all ratings in the FactSet dataset have been normalized according to the following table:
| Rating | Description |
|---|---|
| 1 | Buy |
| 1.5 | Overweight |
| 2 | Hold |
| 2.5 | Underweight |
| 3 | Sell |
As analyst ratings and reports are provided as a free auxiliary service, they act as a value-add for the firm's brokerage and trading desks instead of a primary and monetizable product. In the best light, the recommendations act to inform or supplement the firm's clients' views of a given stock instead of defining it. The more contrarian and critical view is that the recommendations are little more than entertainment and exist entirely to drive trading activity for the firm. After all, how much predictive power could these ratings actually have? If the equity analyst did indeed have any alpha, why would they be working at a sell-side firm publishing reports instead of trading with their own money or at a buy-side investment firm? A third possible explanation is that the very existence of the ratings, especially from so called all-star analysts, manage to move the market, in effect becoming a self-fulfilling prophecy.
From the theoretical viewpoint of the Efficient Market Hypothesis (EMH), the value of analyst ratings is clear: since analysts are not incorporating any genuinely new or unique information into their reports and ratings, they should not have any predictive power. In this view, reading public filings and listening in on earning calls cannot possibly help, since this information gets quickly absorbed into the market price, thus rapidly rendering the ratings useless. In addition, the very existence of the ratings themselves cannot affect the value since no rational investor would trade on information already incorporated into the price. Despite the intellectual appeal, this strong EMH has become niche over the years as the mania of the market has become more apparent with the advent of the dotcom boom/bust and the great recession.
While the academic and professional consensus is still unclear, there does seem to be evidence in the literature that analyst recommendations do hold some predictive power. In Hemang Desai, Bing Liang & Ajai K. Singh (2019), the authors find a number of interesting effects:
- All-star analysts outperformed their peers.
- There seems to be major herding behavior among analysts.
- Analysts who only cover one sector have better predictive power than those who are responsible for covering multiple sectors.
In Brad Barber, Reuven Lehavy, Maureen McNichols and Brett Trueman (2002), the authors construct a long/short market-neutral portfolio based on analysts' recommendations and realize a 4% annualized return on the portfolio.
As suggested by the aforementioned papers, it is possible that some analysts have some predictive power, but the caveats are long and many: How do we tell the good analysts from the bad? In what market conditions are the ratings likely to be correct? With such strong herding behavior, how independent are each rating? What does the actual scale mean, and how do we know, for example, that "hold" means the same thing for all analysts? The questions go on and on, muddying the waters significantly. In the next section, we will construct a long/short market neutral portfolio in an attempt to try to answer the fundamental and basic question on everyone's mind: can I make money from analyst recommendations?
Using Analyst Recommendations, the Simple Way
Unfortunately, the FactSet data available on Quantopian is somewhat limited, containing only 7 relevant fields:
| Name | Description |
|---|---|
buy |
number of buy recommendations |
over |
number of overweight recommendations |
under |
number of underweight recommendations |
sell |
number of sell recommendations |
total |
total number of recommendations |
mark |
average recommendation |
no_rec |
number of missing recommendations |
We don't have access to individual analyst recommendation in this data
sets, and therefore will not be able to pick up when an individual
analyst changes her recommendation. To start off with, we will just
simply be using the mark field to construct our alpha factor. We
construct our market-neutral factor based on the following equation:
We take the negative of the mark field since 1 is a buy and we want to
long positive ratings and short negative ones. We then rank from 1 to
$n$, with $n$ being the most highly recommended stock. After that we
Z-score in order to fit the data into the standard normal distribution.
For our universe we'll use Q500US, which is comprised of the 500 most
liquid securities using a 200-day average dollar volume, capped at a max
of 30% of equities in any single sector. We set our start date at
2003-01-01 with an end date of 2019-01-01, though, ideally, we would
save more data for out-of-sample testing.
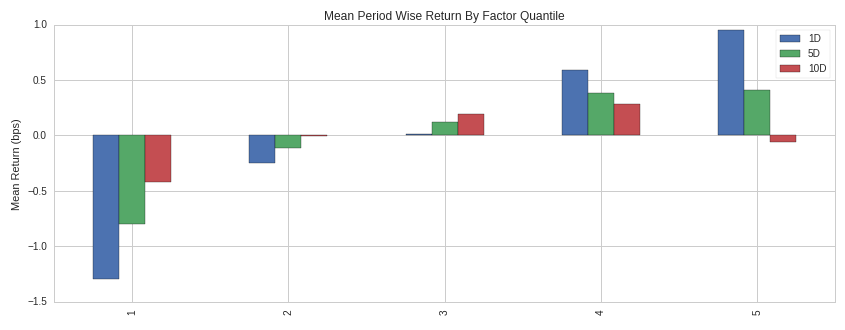
To start out, let's break up our data into quantiles and look at the 1 day, 5 day, and 10 day holding periods to get a better sense of the distribution of returns between quantiles and the persistence or decay of alpha over these periods:
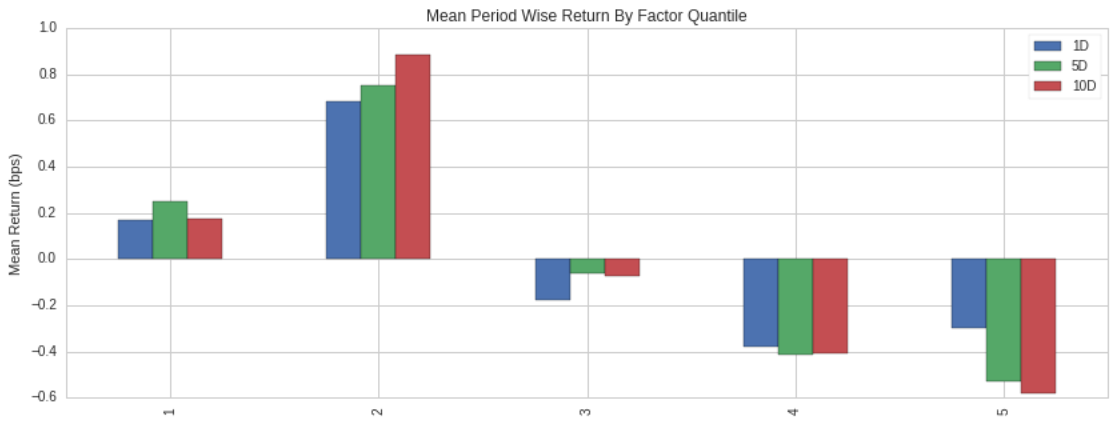
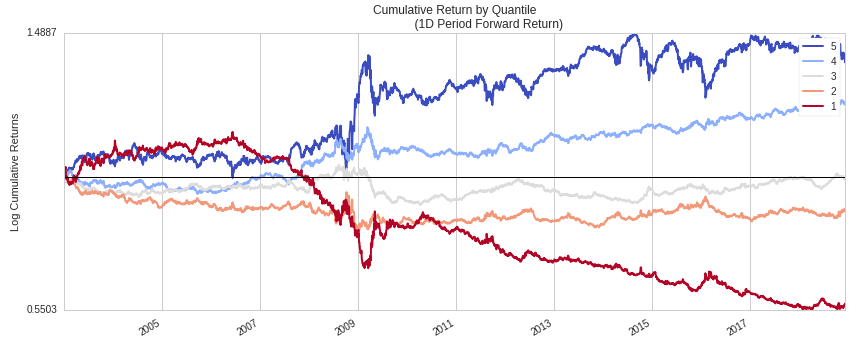
Immediately from this graph, we can see that things are not looking so good for the analyst recommendations. Ideally we would see a monotonically increasing return stream as we move from the lowest to the highest quantile. Since we are shorting all equities in the lower half and longing in the upper half, we are losing money in every single quantile across all holding periods. Digging deeper, let's look at the cumulative return by quantile for the 1 day holding period:
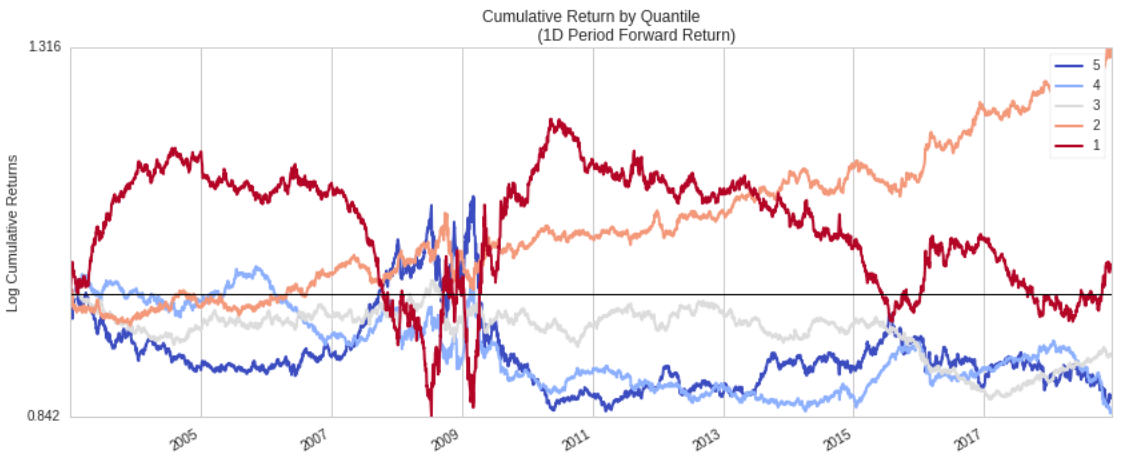
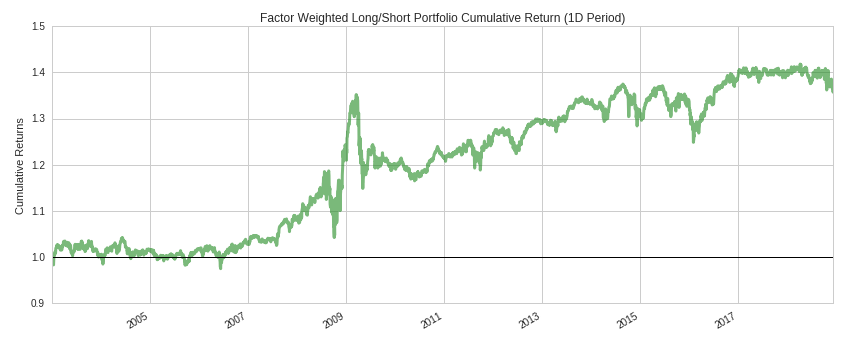
In general, we want the 4th and 5th quantiles to be steadily climbing upward while quantiles 1 and 2 steadily decline. Except for a brief period around the financial crisis, we see the opposite. Putting it all together, let's finally look at the entire long/short portfolio's cumulative return stream:
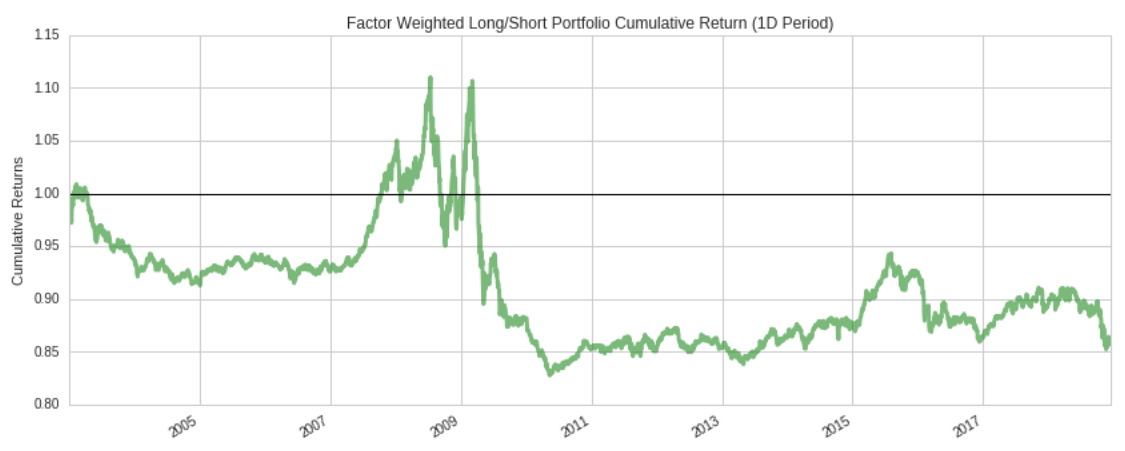
Unsurprisingly (after seeing the previous graphs), the portfolio does not perform exceptionally well over this time period, only making significant gains during the financial crisis and then giving them up (and more) shortly after the start of 2009. While reading time-series graphs of this nature is often akin to reading tea-leaves, we can tentatively hazard a few explanations for the apparent lack of predictive power in the analyst ratings:
-
Perhaps during turbulent market conditions, analysts ratings exhibit higher predictive value than in less volatile environments. In these market regimes, analysts might exhibit less herding behavior as the consequence of being objectively wrong (instead of merely contrarian) becomes more severe. Or put more simply, analysts may get fired for being wrong in bad times while fired for being contrarian in good times.
-
In T. Clifton Green (2009), Green finds systematic mispricing for only two hours after a new recommendation is released. Quantopian only started storing the FactSet dataset in a point-in-time fashion starting November 2018; for data before then, the timestamp is approximated, thus potentially leading to the situation where all the alpha has been traded away before the backtester has access to it.
-
In Christophe, Stephen & Ferri, Michael & Hsieh, Jim (2010), the authors uncover evidence of abnormal and unusual levels of short-selling in the three days before analyst downgrades are announced. This might suggest that individuals and firms are trading on inside information obtained from analyst recommendations before their official public release, reducing or eliminating any alpha our strategy can capture.
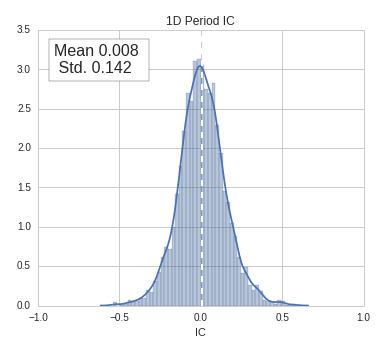
Whatever the case, using the data available, there unfortunately does not seem to be a persistent abnormal return associated with the portfolio. There is however one hopeful statistic that indicates there could possibly be some value in analyst ratings, the Information Coefficient (IC) value:
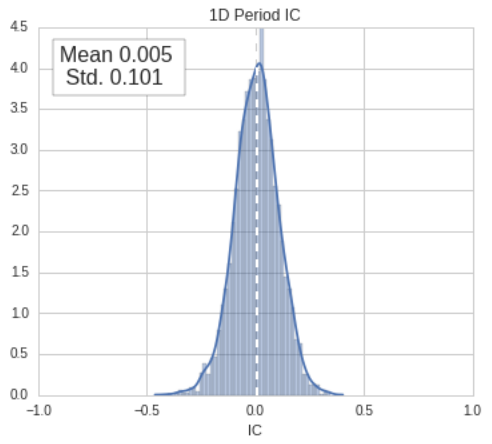
The IC is a measure of predictive power, or the correlation between the expected or predicted return and the realized forward return bounded between -1 and 1. An IC of 0 indicates no edge, that is, there is no relationship between the expected return and the forward return. A value of 1 indicates a perfect correlation between the two, while -1 means that the prediction is always incorrect. Despite the strategy yielding no cumulative abnormal return, the mean IC is, albeit slightly, positive; thus implying that the predictive power of analyst recommendations is better than random.
Using Analyst Recommendations 2.0
It is clear that using just analyst ratings is not sufficient to generate and sustain abnormal returns. It might be helpful to go back and remember what exactly we are trying to do by using analyst ratings: we are trying to find predictive information that has not yet been incorporated into the price of the equity. Put a slightly different but similar way, we are looking for an expert minority view not shared by the rest of the market. It might stand to reason, for example, that if the stock is going up and the average analyst recommendation is a buy, then either the buy rating has already been priced in or analysts don't possess a significantly different outlook on the stock than the rest of the market. On the other-hand, if the stock has an average rating of buy but the stock is declining in price then it stands to reason that the analysts hold a (presumably) expert minority opinion that is not shared by the rest of the market yet. Below is a table illustrating the four primary conditions and the corresponding actions based on the aforementioned hypothesis:
| Recommendation | Direction | Action |
|---|---|---|
| Buy | Up | No Action |
| Sell | Down | No Action |
| Buy | Down | Long |
| Sell | Up | Short |
We can easily construct the corresponding factor as follows:
\[f=\text{Z}(\text{rank}[-\text{SMA}_{20}r_{daily}]\cdot\text{rank}[-mark])\]Where SMA is the 20 day simple moving average and $r_{daily}$ the daily (close-to-close) returns. This factor will allows us to create a market-neutral portfolio that longs stocks that have had poor last month returns but positive analyst ratings while shorting stocks that have had good returns and negative ratings. As like before, let's start off by looking at the daily mean return by quantile:
Not bad! As desired, we have a nice monotonic progression from the first quantile to the fifth. From this graph, it's clear that our alpha decays rather quickly with time, so let's focus on the one day holding period's cumulative return by quantile:
Again, not terrible: we see the upper quantiles move steadily upward while the lower quantiles move steadily downward. Now for the total long/short cumulative return chart and IC:
From the IC and cumulative returns, it is clear that the portfolio constructed from the above factor possesses abnormal return (for a a market-neutral portfolio, any return greater than zero could be considered abnormal). Even though this is an absolute return strategy (i.e it has no comparable benchmark), it's illustrative to compare with the S&P 500 as many investors will implicitly benchmark all strategies to vanilla market returns:
| Metric | L/S | S&P 500 |
|---|---|---|
| Beta | 4.6% | 100% |
| Ann. Ret | 1.7% | 8.4% |
| Ann. Vol | 6.2% | 17.9% |
| Ret/Vol | 0.31 | 1.34 |
Unfortunately, after looking at the above table, it is clear that even though our strategy demonstrates abnormal returns, investors would not find it an attractive investment. The unlevered return is below the usual cost-of-capital (i.e risk-free rate) so it would be difficult to lever up the strategy in order to increase returns. Even if we could borrow at a zero percent interest rate, it is unclear why would even want to as the S&P 500 has a better return to volatility ratio over this time-period; in other words, an investor could just invest a third of their money in the S&P 500 and receive both better returns and volatility than our strategy. Perhaps the only saving grace is the low market (beta) exposure, but with so many other uncorrelated asset classes that have much better risk/reward profiles, the strategy is functionally useless.
Conclusion
Though one can reasonably conclude that there is some predictive value in analyst recommendations, using the recommendations alone does not constitute a viable strategy. However, when combined with other conditional factors such as price, sentiment, or fundamentals data, analyst recommendations might very well boost the IC and Sharpe ratio of the strategy. Moreover, perhaps alpha can be found by utilizing non-mean aggregate characteristics of the recommendations, such as skew or standard deviation.
Thanks for reading and I hope you enjoyed this post! If you want to check out the Quantopian notebook, click here.